

From Slow Streets to Fast Lanes: Navigating San Francisco’s Roadways
San Francisco is a city of hills, views, and—increasingly—intentionally different speeds. If you’ve walked through the Richmond or biked through the Mission recently, you’ve likely noticed the purple signs and plastic bollards of the Slow Streets program. But how did we get here, and where does the "fast" data live?
Using public data from SF Open Data, we’re diving into the history of our shared spaces and the big-picture reality of speed across the 7x7.
The Birth of the "Slow Street"
The San Francisco Slow Streets program wasn't a slow burn; it was a rapid response. Launched in April 2020 by the SFMTA, the initiative was born out of necessity during the COVID-19 pandemic. With transit capacity slashed and the need for socially distanced exercise skyrocketing, the city transformed residential corridors into shared spaces.
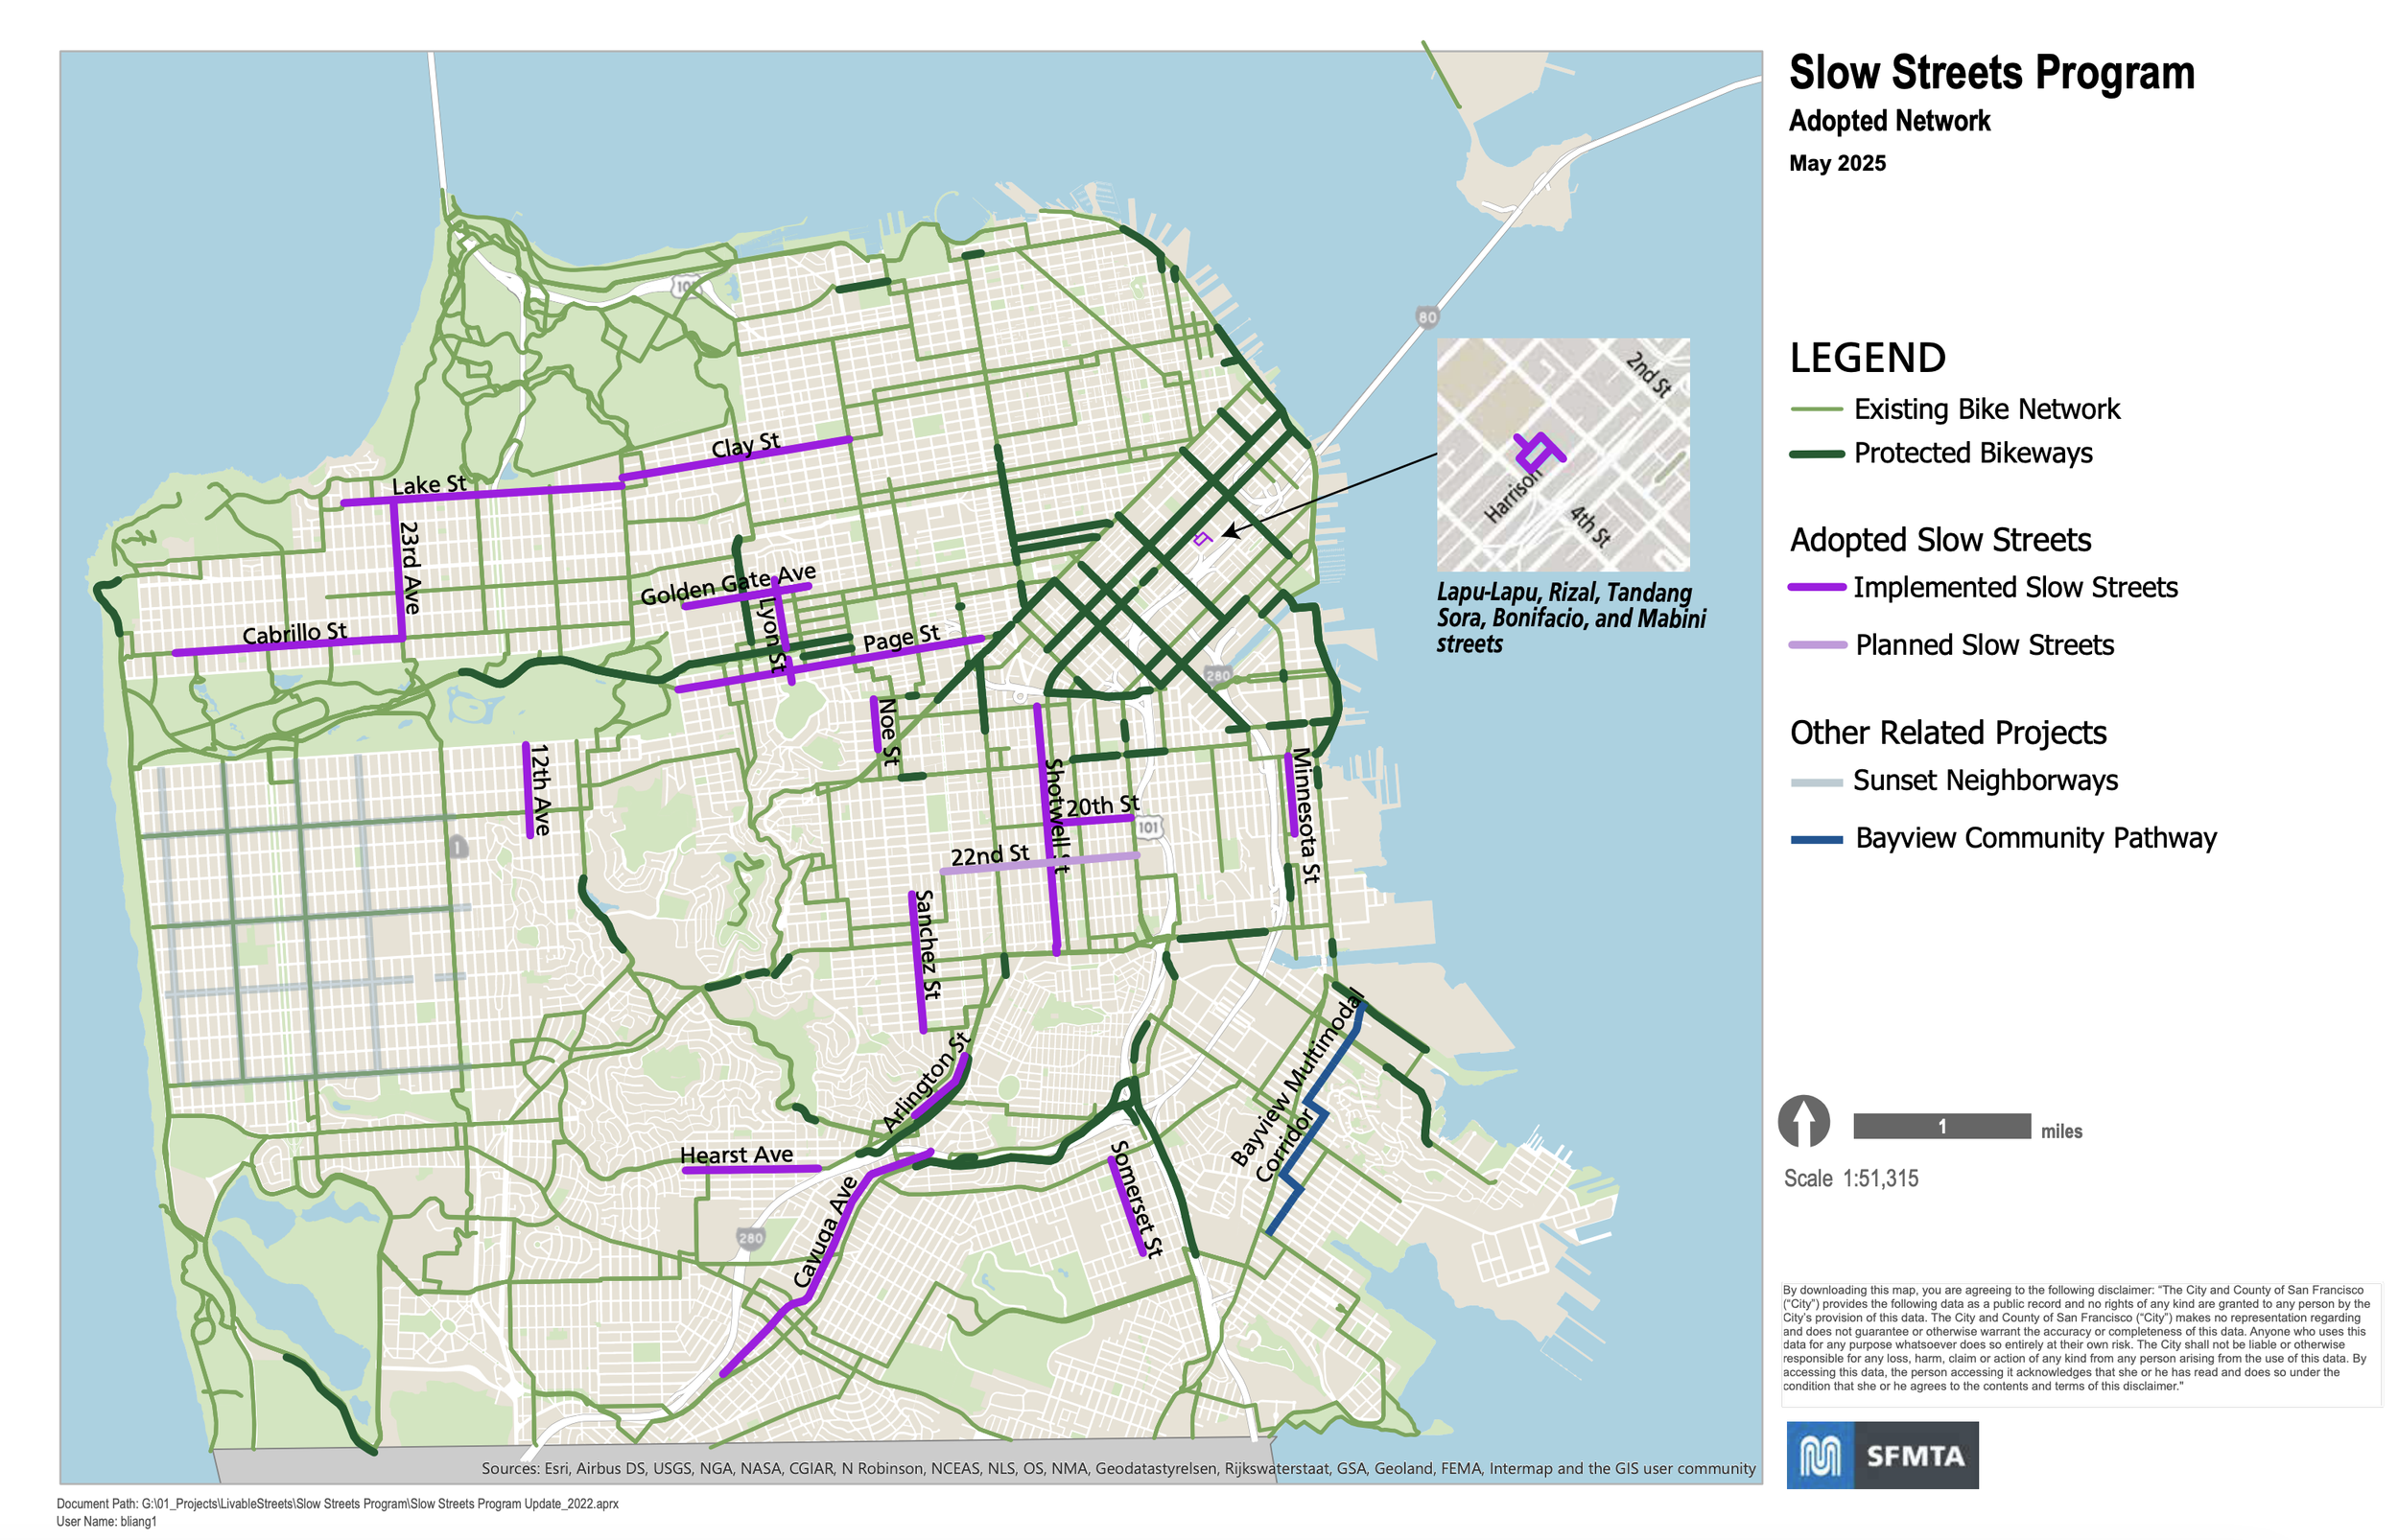
The goal was simple: limit through-traffic so that people walking, biking, and rolling could use the full width of the pavement safely. What started as a temporary emergency measure became a beloved fixture of city life. By December 2022, the SFMTA Board made the program permanent, selecting a network of corridors (like Lake Street, Sanchez, and Shotwell) to remain low-traffic hubs indefinitely.
The Slow Street "Golden Rules"
According to the city’s benchmarks, a successful Slow Street should aim for:
Vehicle volume: Fewer than 1,000 cars per day.
Vehicle speed: 15 mph or less.
The Big Picture: Where are the "Fast" Streets?
While we celebrate the 15 mph quiet zones, the rest of the city operates on a much different scale. To understand the contrast, we looked at the Map of Speed Limits provided by DataSF.
While the "de facto" speed limit for most residential and commercial streets in SF is 25 mph, the "Fast Streets" are the arterial veins that keep the city moving.
SF’s High-Speed Arteries
If you’re looking at the data, the "Fast Streets" (excluding highways) generally fall into the 35–45 mph range. These include:
Park Presidio Blvd: A major north-south connector.
The Embarcadero: High-volume traffic along the waterfront.
Geary Blvd: The backbone of the Richmond District.
Sloat Blvd: A high-speed thoroughfare near the Zoo.
Data Deep Dive: Compliance vs. Reality
It’s one thing to post a sign; it’s another to follow it. The San Francisco Speed Limit Compliance dataset gives us a fascinating (and sometimes sobering) look at how drivers actually behave.
On our Slow Streets, compliance is driven by "soft-hit" posts and traffic diverters—physical reminders to slow down. On the faster arterials, the city uses automated speed cameras and engineering (like narrower lanes) to try and bring "actual speed" closer to the "posted speed."
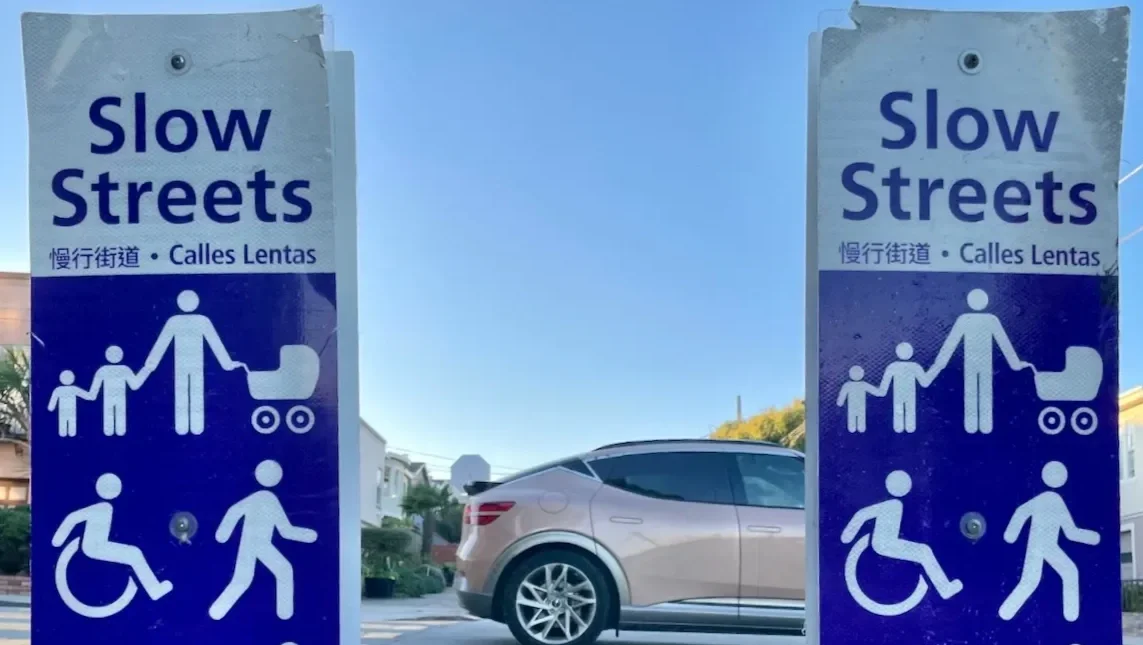
Purple Signage Across Designated Slow Streets
Why Does This Matter?
The data shows a clear trend: when we design streets for people (Slow Streets), we see a significant drop in collisions. For example, Page Street saw a 55% decrease in vehicle crashes after being designated a Slow Street.
By balancing these quiet neighborhood corridors with efficient, high-speed transit arteries, San Francisco is attempting to create a "multi-modal" city where you don't always need a car to get where you're going safely.
Want to explore the data yourself?
Check out the SF Open Data Portal to see the latest updates on speed limits, bike lanes, and urban planning in your neighborhood.